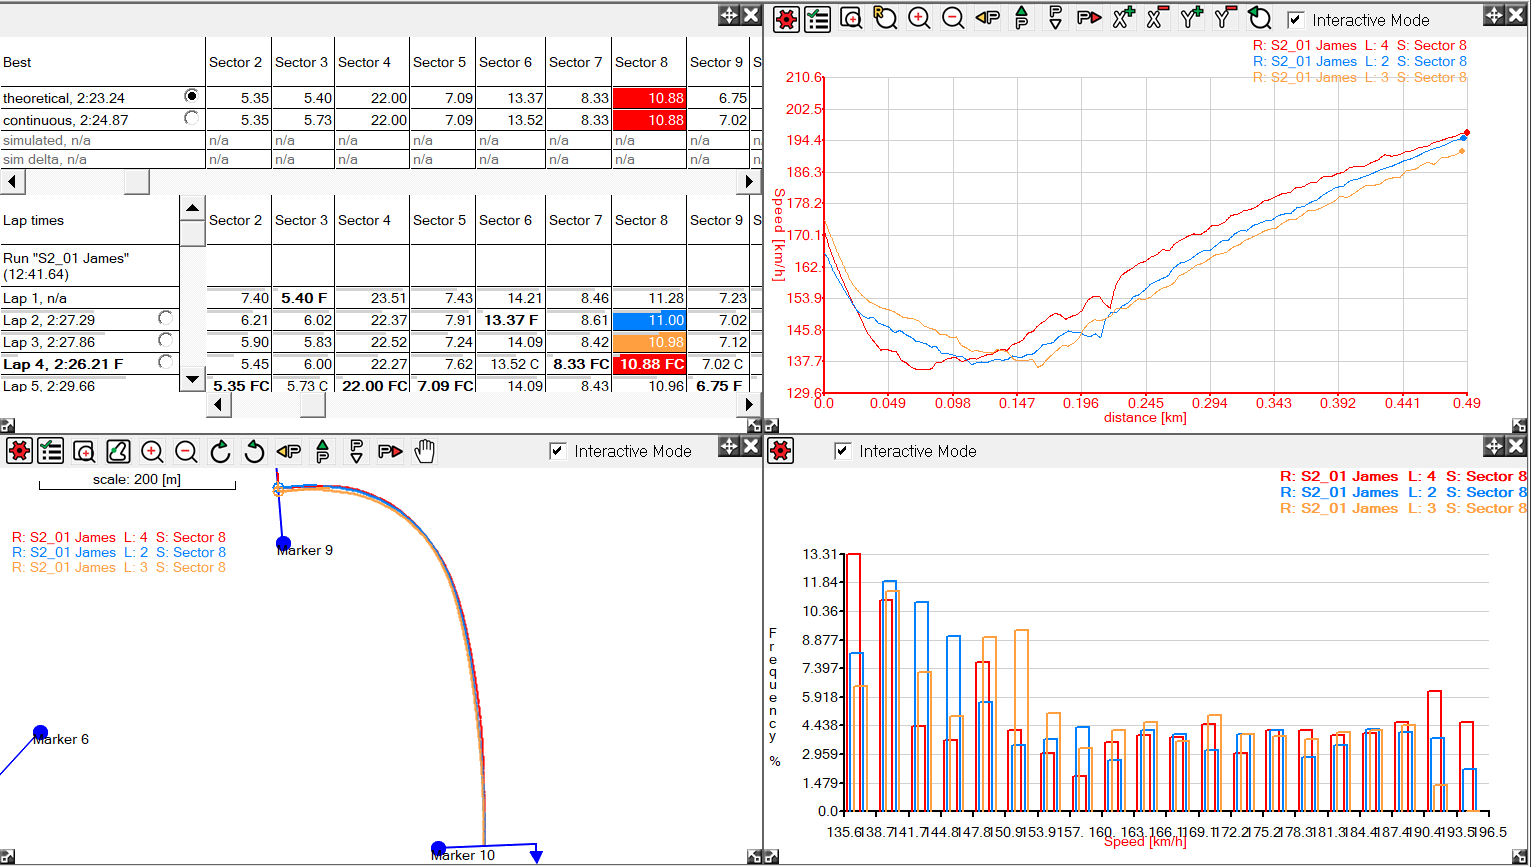
Interactive Mode
Interactive mode is an option on all graphs and the track maps. Interactive mode is always enabled on the Quick XY Graph, Performance Calculation Table, Summary Statistics tables (when in "Display for selected area" mode).
Basically, interactive mode displays data for only the selected range. It will always zero the X-axis on the XY Graphs, and when no data is selected, the screens will appear empty with a message telling you so. you can not select a range on interactive mode, only a point.
To activate interactive mode, you need to click the check box at the top of the window you wish to activate interactive mode on: 
Initially, if you have no data selected, then you will be shown nothing on the graph and track map window. To display data, you have to select a range, either on a window that isn't in interactive mode, or on the lap and sector times table or the summary statistics table etc. Once you have a range selected, this will be displayed on the interactive windows. Now you will be able to select a point which will be cross linked across the windows as normal, but you wont' be able to select a range.
If you are selecting ranges from the Lap And Sector Times table, or the Summary Statistics window, you will be able to select more than one range, as long as they coincide (i.e. they are the same sector or lap etc). When you select a range in interactive mode, the Track Map (if open and in interactive mode) will automatically zoom to the location of the range and auto-fit it to the window. Multiple ranges will be displayed only if they are the same lap or sector. An example is shown below:
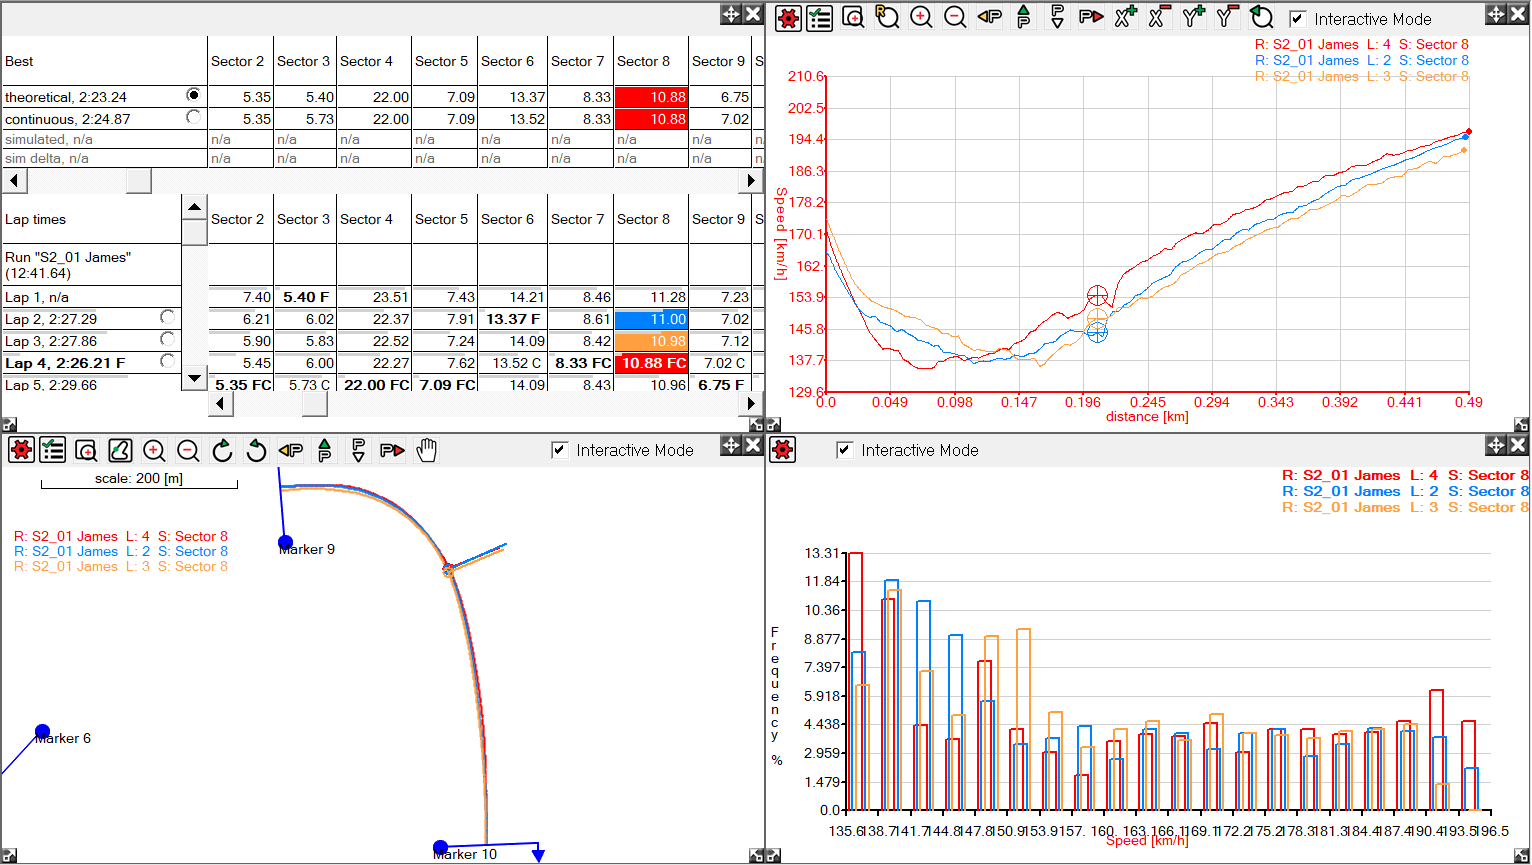
If you now select a point on track map, the display will change to the following:


