How do I attach my own sensor (bought elsewhere, or already on the car)?
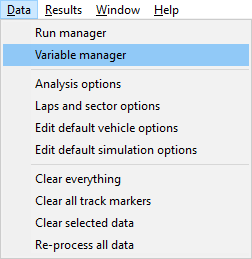
Step 1: Load in your run to the analysis software and enter the "Variable Manager" option in the Data menu. Or click on the  icon in the toolbar.
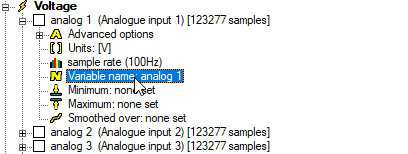
Step 2: Expand the "Voltage" sub menu and select a "Variable Name".
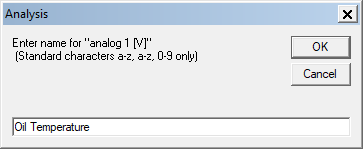
Step 3: This will open up a window. Enter an appropriate name for the sensor and press "OK".
Step 4: Make sure that you have made a note of the formula that has been created for the sensor in the DASH2 configuration software (See the section on connecting your own sensor to the DASH2 for information on how to do this).
Step 5: Enter the "Units" option on the variable manager menu. Click the button next to the word "Custom", and then enter the formula in the space provided.
N.B. The formula must be entered in the format shown in the example below, not in the format shown by the configuration tool.
Compare the two examples given to see the differences in format:
Step 6: Now choose the units that you wish to be displayed. In this example, °C was chosen. When you are happy, press "OK".
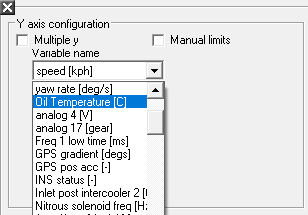
Step 7: Open up an xy graph and press the "Data options" button  in the top, left hand corner of the window. This will open another window. Use the drop down menu that is under the heading "Variable Name" to select the variable that you wish to show on the graph.
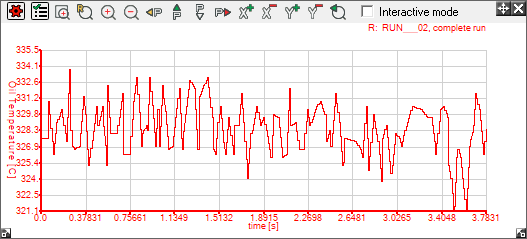
Step 8: A graph will now be shown.
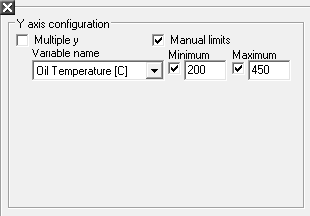
Step 9: To make it more intelligible, re-enter the "Data options" window and tick the "Manual Limits" box. This will enable you to enter maximum and minimum values for the y axis,
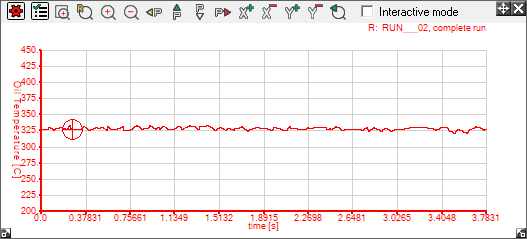
Step 10: That will leave you with a more easily readable graph.

 icon in the toolbar.


 in the top, left hand corner of the window. This will open another window. Use the drop down menu that is under the heading "Variable Name" to select the variable that you wish to show on the graph.
