Variable scaling
This section describes how to set up the conversion of a voltage/frequency to a "real" physical quantity, for example air temperature, fuel level, oil pressure. You can also use the variable scaling option to change units, for example speed in mph or kph.
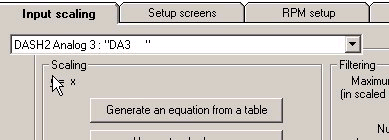
To begin, select the variable that you want to set the scaling from the drop down list:
You scale the input to the output using an equation y = a + bx + cx^2 + dx^3, where y is the scaled output, x is the input and the user can set a,b,c,d. This equation is termed a 3rd order polynomial and can be used to match the output of most types of sensor available. There are 3 ways to enter the equation:
- You can generate the equation from a table of information - for example if you have calibration data to convert voltage into temperature, or fuel level use this option.
- If you are using a standard sensor supplied by Race Technology, you can simply select it from the list as we've already worked out the equation required
- If you want to do some simple scaling of the input, or have an equation from an external source (excel for example) you can enter the coefficients manually.
The equation currently in use is displayed at the top of the scaling box. In this case y=x so the output simply equals the input. To enter the equation, click on the method required:
Generate an equation from a table
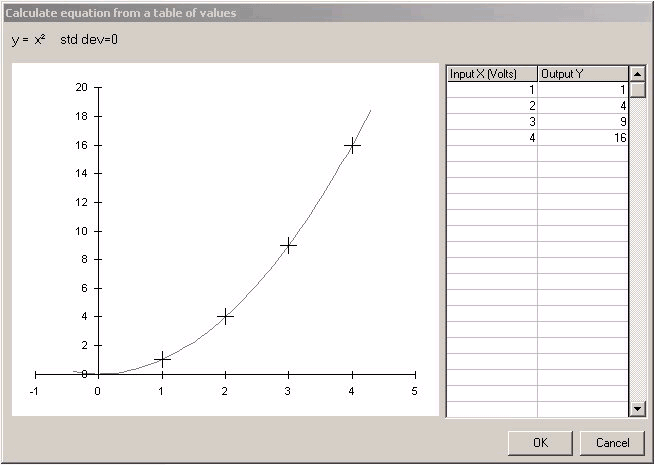
Once the button is clicked the user will be presented with the following dialog box:
The box is divided into 3 areas:
- The table to the right of the box is where the table for the calibration data is entered. The input data is entered into the left hand column and the output is entered into the right hand column. The information must be entered in pairs and there must be between 1 and 25 unique points entered for the program to calculate an equation. As you enter or edit each point you will see that the graph and the equation update.
- The graph to the left of the box displays both the data points that have been entered (they are shown as the + marks) and the equation that has been fitted to the data (the equation is shown as the curve). The graph is scaled according to the input/output data points that are entered into the table. You can edit the points on the graph (which also updates the table). To do this select the point on graph by click on it and then move it using by holding down ctrl and using the cursor keys.
- Finally at the top of the box the equation is displayed, as well as the standard deviation of the fit. The standard deviation indicated how well the data fits the points, a standard deviation of 0 is a perfect fit, the higher the number, the worse the fit.
There are a couple of things to note:
- The equation that is fitted to the data is the best fit by minimising the square of the error between the data points and the curve - however it's not always possible to force the equation though all the points, it simply does the best that can be done.
- Equations are very useful for interpolation, but useless at extrapolation! For example if you calibrate an air temperature sensor from 10 degrees to 80 degrees, then the sensor should only be used over this range - the calibration would not be valid at 100 degrees for example.
- You can cut and paste the information from the table into and out of excel by highlighting the data and right clicking, then selecting the required option.
- If you click OK, the the equation is applied to that channel, if you click cancel all the changes are discarded. In all cases once you close the dialog box there is no way to recall the data points that you entered. If you think you might want to go back to the original data at some point, then the user is advised to cut and paste the data to an external source.
Use a standard sensor/unit
If you are using a standard sensor as supplied by Race Technology, then the process is very simple - just select the sensor from the list. This also applies to changing speed units.
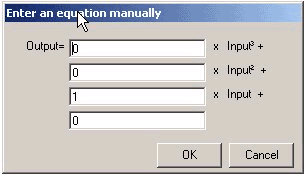
Enter an equation manually
If you have an equation that has been worked out in Excel, or from a 3rd party, or you simply want a simply scaling/offset then it is simplest to enter the equation manually.
Simple examples are:
- output = 1 x input .... as shown in the case above, this means there is no scaling and the output = input
- output = 2 x input. This doubles the input
- output = input + 1. This adds an offset of 1 to the input
- output = -1 x input. This "inverts" the input, or changes it's sign


