1.1 The Performance Tables
The first of the three built in performance tables shows Speed Versus Time, which shows, for the highlighted data, how many seconds it took to advance from the start times, to the end times. Please note that these will be cumulative results.
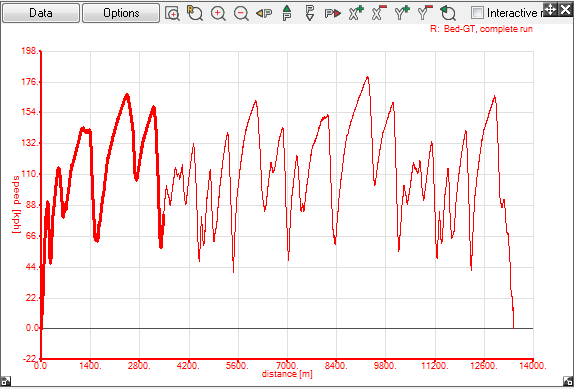
The above highlighted data on the graph is for a section of acceleration and cornering. The times in the 0mph column are the times it took for the vehicle to reach the speed associated with the row. The times for acceleration are highlighted in red. As in the speed graph, there are some braking points, these are shown in blue from the start speed to the end speed. By this rule, the cumulative total of the speed versus times for deceleration go from the bottom up where applicable.
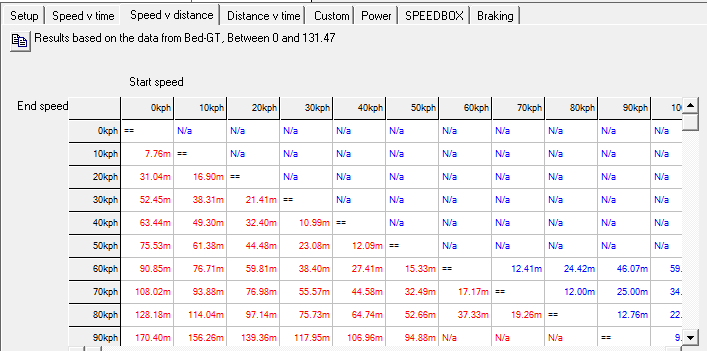
The second of the built in tables is Speed Versus Distance. This table is identical to the Speed Versus Time table, except the results are the distances it took to reach the speeds. For the same set of data as above, the Speed Versus Distance table gives the following results:
The final built in table displays the Distance Versus Time. This table shows the time taken to cover distances from a standing start. The maximum distance will be 30 times the "Distance interval on tables" value in the Setup and Options tab. The results it will display for each distance is the time it took to cover the distance, and what speed the vehicle was travelling at when it passed the distance.
Please note that if sometimes the software won't be able to detect the acceleration trigger, and as a result, nothing will be displayed here. Make sure that you adjust the "Trigger acceleration for test" value in small increments until you get a result. Also note that unless you save the window as a Custom Or Default Window, the settings will be lost when you close the window.


