View options:
Map Colour Based On – Gives a colour representation on the displayed maps of the variation between the maximum and minimum values of the variable selected. The limits will be automatically set up on the data selected. Use the adjacent drop down menu to select which data set you wish to analyse.
Display G Force Vectors – This option shows a graphical representation of the longitudinal and latitudinal acceleration for the vehicle. This is initially selected, acceleration is displayed as a vector tangential to the course, trailing from the point to show positive acceleration and leading the point to show negative acceleration (braking). The vectors that appear normal to the course show the latitudinal force, indicating the weight shift on the vehicle.
Reverse G Force Vectors Display – Inverts the direction the vectors described above are displayed.
Offset individual maps – For when multiple plots are selected (see below), this option offsets each plot by a small amount to allow easier comparison of different runs, laps or sectors.
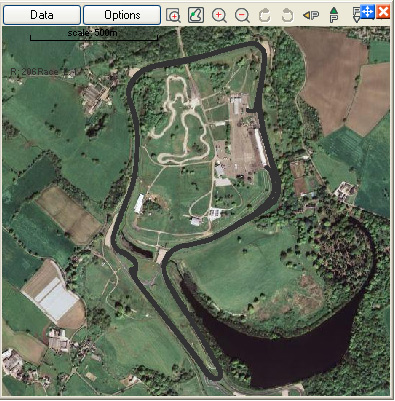
Download map as background – literally does what it says - it allows you to download a map or aerial photograph from the net and use it as the background for your trackmap: see the example below:
Read The Downloading Maps as background section for more details on this.