Stepping Through Data
Once you select a data point(s) on a graph or a track map by clicking on it, you can go over the data step by step by using the curser keys. Following table shows the step sizes with their respective key combinations. Step sizes are in seconds. i.e. 1 step = 1 second
Please note that this feature is only available from version 7.3.0.119 of Analysis.
| Key Combination
| Step Size
|
SHIFT + LEFT ARROW
or
SHIFT + RIGHT ARROW
|
0.01s
|
CTRL + LEFT ARROW
or
CTRL + RIGHT ARROW
|
0.1s
|
SHIFT + UP ARROW
or
SHIFT + DOWN ARROW
|
1s
|
CTRL + UP ARROW
or
CTRL + DOWN ARROW
|
10s
|
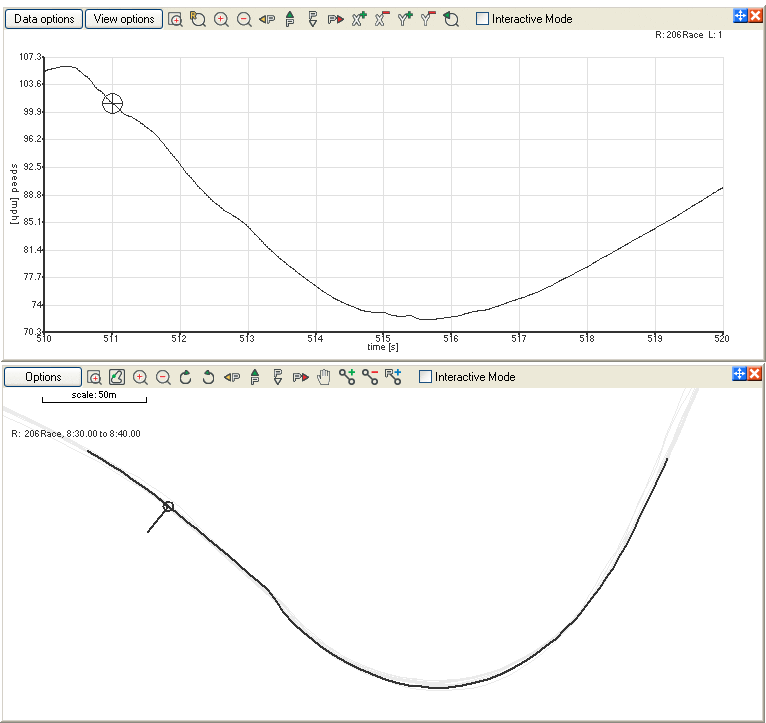
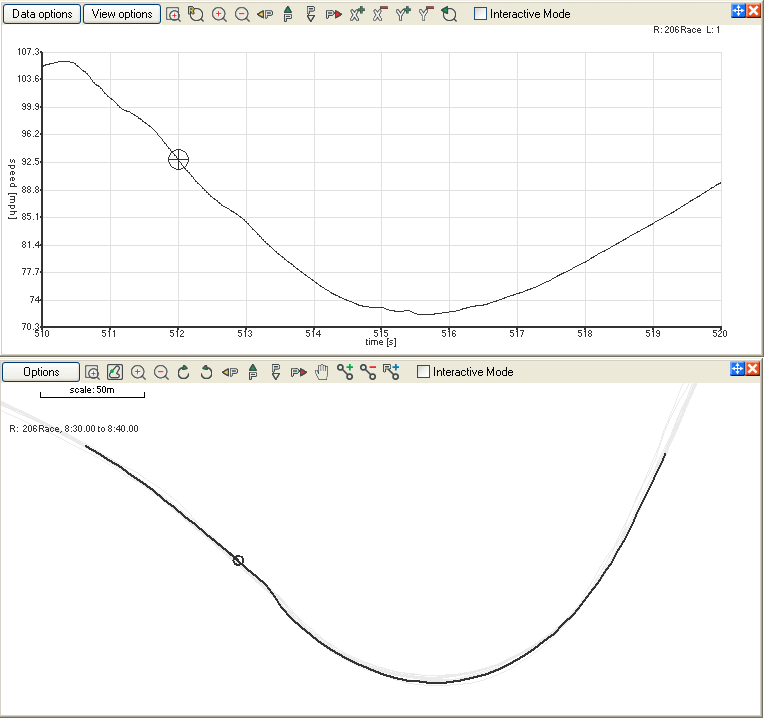
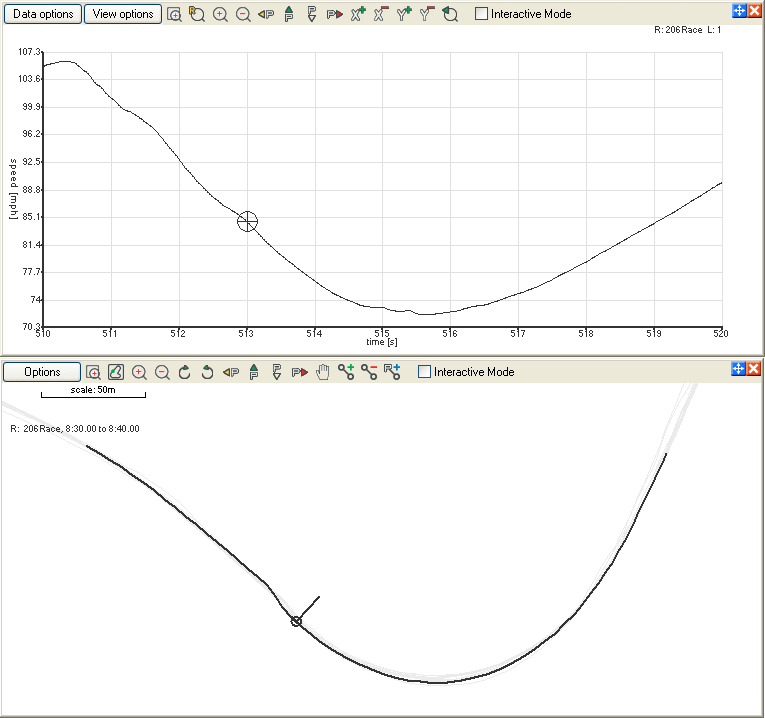
In the following example we use Track map and XY graph to illustrate how to step through data, 1 second at a time.
1. Open the XY graph and click on the Data options button.
2. Select Speed for the Y axis and time for the X-axis.
3. Select the Manual data limits option in the X axis configuration section and enter the maximum and minimum values. then close the Data options window.
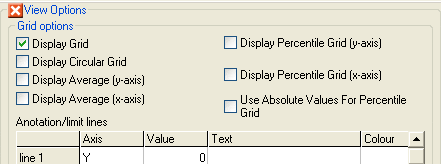
4. Open the View Options by clicking on the View Options' tab.
5. Select Display Grid option and close the window.
6. Click on the Options button on the Track Map window.
7. Uncheck the set by laps/sectors option in the Use Data from section.
8. Enter the minimum and maximum values. these minimum and maximum values should be equal to the values you entered in the step 3. Then close the Options window.
9. Select a point on XY Graph or track map using the mouse.
10. Press CTRL + LEFT ARROW (or CTRL + RIGHT ARROW) keys to step thorugh the selected range.


