How do I open graphs, and get them to display either multiple variables or multiple runs?
To open up an XY graph, click on the relevant icon in the tool bar at the top of the screen.
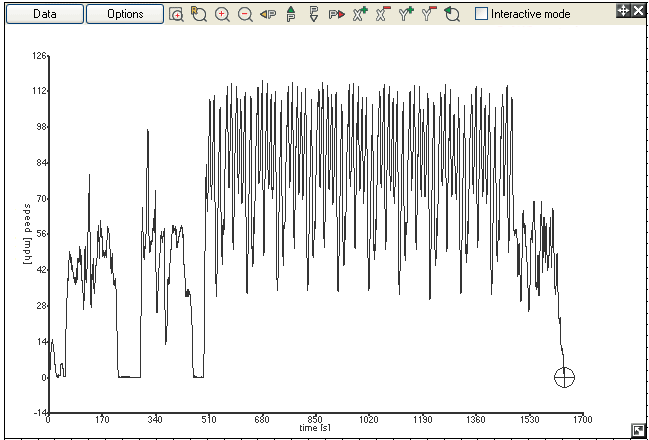
A window will open up, displaying a graph of the run that you are studying.
To change the variables that are displayed on the graph, press the data options button in the top, left hand corner of the window.
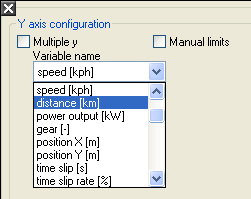
The "Data Options" window will allow you to select the variables that you wish to display from a drop down menu.
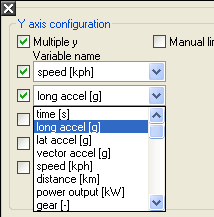
To display multiple variables on the Y axis, tick the "Multiple Y axis" box, and select the variables from the drop down menus that appear below.
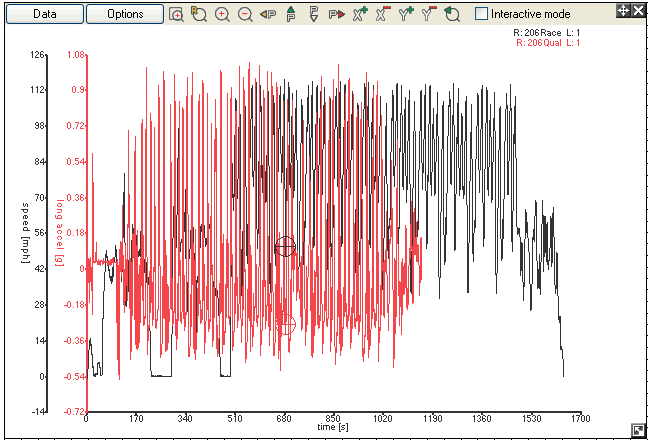
When you are happy with your choices, close the window. The graph will now display all of the variables that you have chosen.
To simultaneously show multiple runs, enter the "Data Options" window, and tick the "Multiple plots" box...
You may now select the runs that you wish to display.
Now, when the window is closed, the graph will display all of the selected runs.


