|
|
UserInterface / MenuBar
Menu Bar
Below is an overview of the menus and their sub-functions. By clicking on the menu function, you will be taken to the relevant information on that option.
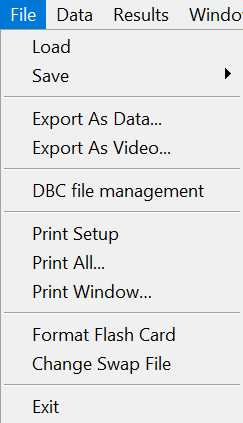
File menu
| Load
| This command is used open following file types:
- RUN (up to 20 .RUN files simultaneously)
- RAF - session data
- CAR - vehicle options
- SIM - simulation options
- CFG - general options
- LAP - Loads saved track markers and sectors, useful if you have several different .RUN files for the same course.
- LAY - Loads a saved layout for how you have the windows arranged, including layers and settings.
|
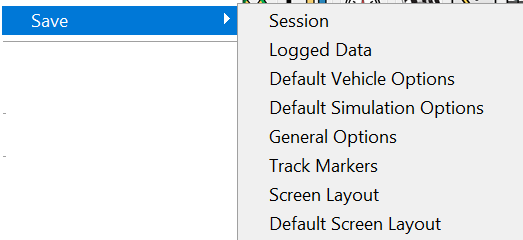
| Save
| | Session
| Allows saving the session to a permanent storage
| | Logged data
| Saves the processed data to a new .RUN file
| | Default vehicle options
| Allows you to overwrite the default vehicle settings. Useful if you're going to be using the logger for the same car repeatedly.
| | Default simulation options
| Save default simulation options to a .SIM file in your PC
| | General options
| Store general options as a .CFG file in the PC
| | Track markers
| Saves your track markers and sectors for a course, so that you can use the same ones if you have a different run, for more accurate comparison and analysis.
| | Screen layout
| Saves your current screen layout, including layers and settings, for later use.
| | Default Screen layout
| Use this option if you want to open the current layout every time you run Analysis software
|
| Export as data…
| Allows you to export the data into a .CSV file to use with excel, or a choice of .M or .MAT files for use with Matlab, or a plain text file.
| | Export as video…
| Opens the Video Export Wizard that allows you to export the videos generated using GoPro cameras to several popular export formats. You can export a whole run, and arbitrary section of a run, or a particular lap or sector and then export to the target format with or without an additional overlay.
| | DBC file management
| Launches Variable and DBC Manager
| | Print Setup
| Set up your printer settings, Printer, Quality, Number of Copies, Paper and Page Orientation.
| | Print All…
| Prints all windows open within the analysis program.
| | Print Window…
| Prints a single window selected by the user.
| | Format flash card
| Formats the flash card
| | Change swap file
| If you wish to increase or decrease the size of the swap file which you selected the size when installing Race Technology software, you can do that using this option.
| | Exit
| Exits the Analysis program.
|
Data menu
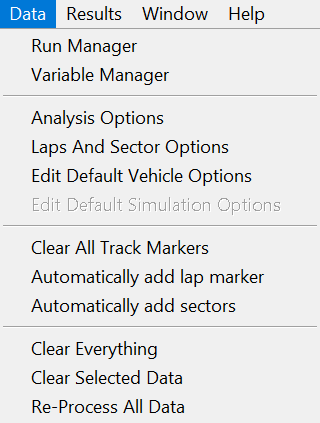
Run manager
|
Allows you to manipulate the .RUN files loaded, change the ambience settings, load a previously saved car file and setup the video inputs. In the video setup you can load the reference video files.
|
Variable manager
|
The Variable Manager allows you to edit the variables used by the software. You can also create custom User Defined Variables based on current variables and constants.
|
Analysis options
|
Allows you to set up options regarding the analysis program.
|
Lap and sector options
|
Change the settings for and add the lap and sector markers. Allows you to edit how many sectors and how they they created.
|
Edit default vehicle options
|
Allows you to change the settings related to the car that was used to create the .RUN file. You can edit settings on the gears, the wheels, the engine, the accelerometers and vehicle constants.
|
Edit default simulation Options
|
Change the default options for Lap Simulation
|
Clear all track markers
|
Removes all track markers from the Track map.
| |
Automatically add lap marker
|
Automatically add a lap marker based on the setting in the "Laps And Sector Options" dialog ( Data -> Laps And Sector Options)
| |
Automatically add sectors
|
Automatically add sector markers based on the setting in the "Laps And Sector Options" dialog ( Data -> Laps And Sector Options)
|
Clear everything
|
Clears all loaded .RUN file data.
|
Clear selected data
|
Equivalent to pressing "Esc" button on keybord which de-selects the currently selected data point or data range within analysis software (using Track map or Xy graph etc.)
|
Re-process all data
|
Reloads all .RUN files.
|
Results menu
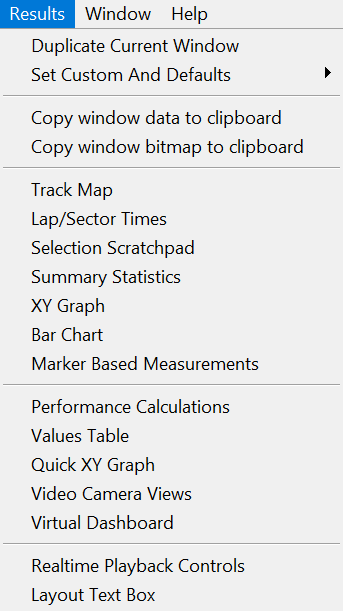 | Duplicate current window
| Opens a copy of the currently selected window.
| |
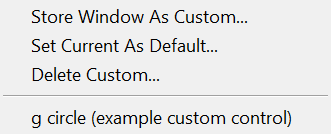
| | Set custom and defaults
| | Store window as custom
| Saves the way the currently selected window is set out for later use. Selectable from the bottom of this window.
| | Set current as default
| Saves the way the current window is set out as the default, so when you load the window off the menus or the toolbar, it opens how you've got it currently set.
| | Delete custom
| Deletes a custom window you have previously saved.
| | G circle
| This is an example for a custom control
| |
| | Track map
| This opens up the track map overview window, allowing you to visually view where the vehicle is on the track at any given time, and allows you to select points or ranges of data to analyse.
| | Lap/sector times
| Opens the Lap and Sector Times table, displaying information on the times taken for the vehicle to pass through the sectors and the laps defined by the markers.
| | Selection scratchpad
| This allows you to store any areas of data that you have selected. You will then be able to return to the selected data as and when it is needed.
| | Summary statistics
| Displays some user definable statistics for areas of the highlighted areas of the track. You can also see the statistics for defined laps and sectors.
| | Xy graph
| Draws a wide variety of graphs representing the data in different ways.
| | Bar chart
| Draws frequency bar charts.
| | Marker based measurements
| This allows you to carry out calculations based on the lap and sector markers. This is similar to the Summary Statistics window, but the calculations are based on the track markers directly rather than on sector definitions.
| | Performance calculations
| This tabulates several different performance metrics for the highlighted range. You can create your own performance tables on the fifth tab, for changes in your chosen variable over distance or a change in speed.
| | Values table
| The values table shows the values of all the variables associated with the selected points, or ranges.
| | Quick xy graph
| Quick XY graph offers similar functionality to the full ”XY graph” window, but can only be used to display data interactively, that is based on the currently highlighted data. It can be used to display up to 5 different variables against time or distance.
| | Video camera views
| Can be used to play GoPro videos associated with .RUN files.
| | Virtual dashboard
| Virtual dashboard consists of configurable data screens which can be used to display any of the variables within the software
| | Realtime playback controls
| Offers some controls to use the video playback (play, pause, step forward etc.)
| | Layout text box
| Can be used to put a note inside the analysis grid.
|
Window menu
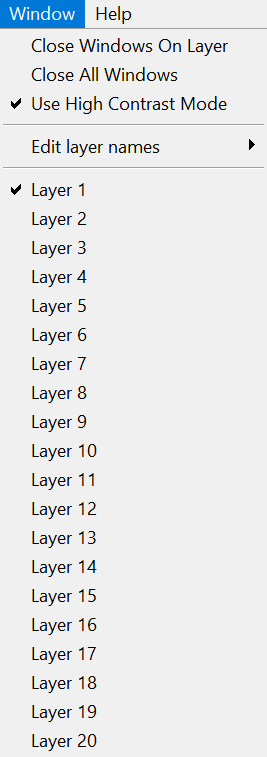
| Close Windows On Layer
| Closes all opened windows on the current layer
| | Close All Windows
| Closes all opened windows on all layers
| | Use High Contrast Mode
| Allows you to turn ON/OFF the high contrast mode
| | Edit Layer Names
| This allows you to give meaningful names to the layers
| | Layer 1 - 20
| Allows you to switch from one layer to another (Note: You can also use "Page Up" and "Page Down" shortcut keys to move to next and previous layers)
|
|