Set up RPM scale
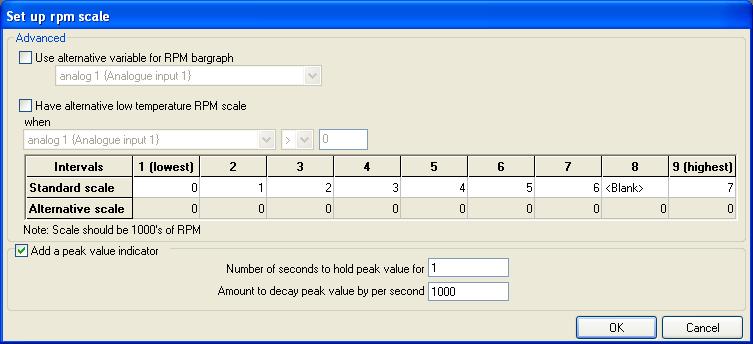
The RPM scale on the DASH2 PRO can be custom configured in terms of the scale and the peak value indicator. If the ‘Advanced Features’ option is enabled, the RPM bargraph can be set up to use any variable as the source of data, and a second bar graph setting can be used at low temperatures.
The bar graph is configured using the DASH2 PRO configuration software. After opening the software click on the ‘Set up RPM scale’ icon.
There are two modes for the RPM scale, ‘Standard’ mode is available all the time, ‘Advanced’ mode is only available with the ‘Advanced Features’ option.
Standard RPM scale set up
In standard mode the rpm value at each of the 9 segments of the RPM scale can be configured. These must increase in value from the lowest interval to the highest interval. It is possible to make the scale more compact by reducing the spacing between numbers, or expand the scale by leaving numbers blank. For example
| Interval
| Value
|
| 1
| 2
|
| 2
| 4
|
| 3
| 6
|
| 4
| 8
|
| 5
| 9
|
| 6
| 10
|
| 7
| 11
|
| 8
| blank
|
| 9
| 12
|
This will give a scale where the scale starts at 2000rpm, so engine speeds below that will not register. The values then increase slowly up until 8000rpm at which the scale changes to 1000 rpm per interval. The last 1000 rpm is split over two intervals so there is much greater resolution for engine speed between 11 000 and 12 000rpm.
Advanced RPM scale set up
By using the advanced options it is possible to use any sensor as the RPM input, to do this tick the box for ‘Use alternative variable for RPM bargraph’
To use an alternative RPM scale setting when the temperature is low (or whenever any required parameter is above or below a set value) select the option for ‘Have alternative low temperature RPM scale’ and then set up the required scale in the ‘Alternate scale’ section of the window.
Peak value indicator
The peak value indicator can be used with the standard or advanced RPM scale options. The peak value indicator will keep a mark on the RPM scale at the highest value reached for a set length of time. The value will then decay at a rate set by the user. It can be useful for seeing the value at which a gearshift took place without having to watch the RPM scale all the time. To use this tick the box for ‘Add a peak value indicator’, set the number of times for which the value should be held before it starts to reduce and set the decay speed in terms of RPM per second. I.E. a decay time of 3 seconds and a decay amount of 1000 will mean that the peak value is shown for 3 seconds, then the marker will reduce at a rate of 1000 rpm per second until it reaches the current RPM value.

