1. Exporting Data
There are several ways to export data from the software.
1.1 Exporting to a .CSV file or to Matlab files
1.2 Exporting data from a graph or table to a spread sheet
1.3 Copy a graph or any tool window as a bitmap to an image editing program
1.1 Exporting to a .CSV file or to Matlab files
Processed run data can be exported to a comma-separated value (.CSV) file or Matlab's .M and .MAT file. This file can then be loaded into 3rd party applications for specialist applications. This option can be useful if you want to share your data with someone else or include data in a presentation.
To export the processed data, go to File > Export as data...
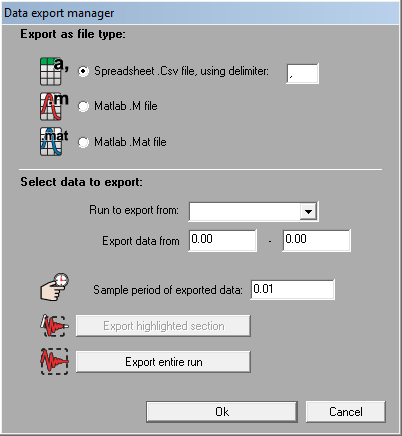
You will be shown a dialog box to select the export type, sample rate and source file and times:
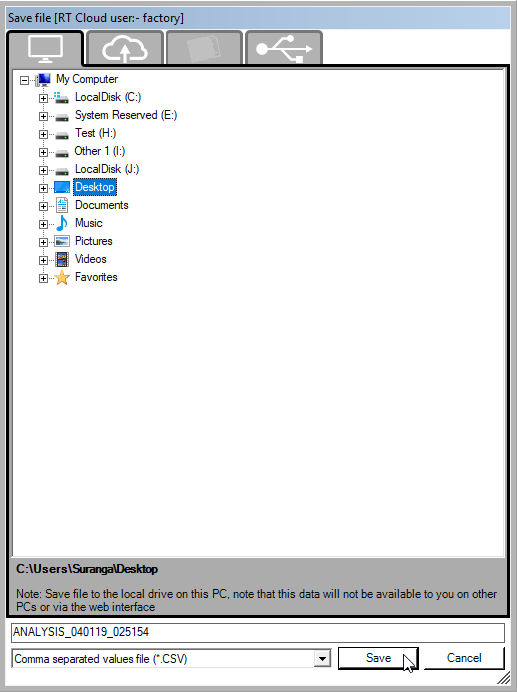
Choose the file type you wish to export to, the data range, and which run you wish to export from. If you have a section highlighted on the track map or graphs, etc. then the Export Highlighted Section button will be available, and this will adjust the times in the box to that of the highlighted section. Alternatively, you can export the entire run. Once you have the times and file set up, click the OK button. This will ask you where you want to save it and what to name it.

WARNING: .CSV files can be very large. A 10 minute run will contain 60000 data samples at 0.01 second intervals, and will result in a file size of around 11MB. Microsoft Excel has a limit of 65535 rows of data, and can only plot 32000 points on a graph (for comparison the analysis software will plot 500000 points). If you are intending to use .CSV files to share data, it is recommended that you keep the runs short and increase the time interval between samples. Similarly Matlab can be very slow to load very large .M and .MAT files.
Note: Without using the Analysis Software, you can export RUN files directly to CSV file format using the Run processor.
1.2 Exporting data from a graph or table to a spread sheet
There are two ways to export data from a graph or a table to a spread sheet:
- by using the keyboard shortcut:
Click somewhere on the graph or table area and press "Ctrl + C" (the normal windows shortcut for copy).
- by using the menu command:
Click somewhere on the graph or table area and use the menu command -
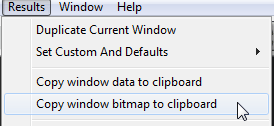
Results -> Copy window data to clipboard
Open Excel or a similar program, select where you want the data and select "paste" to paste the data. Once you have pasted the data, you can use the functions within the software to generate graphs.
1.3 Copy a graph or any tool window as a bitmap to an image editing program
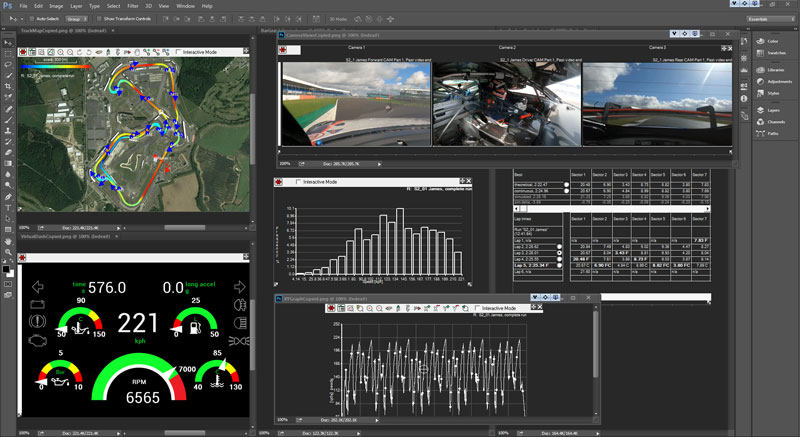
You can copy the graph or any Analysis tool window as a bitmap and paste it into your favourite graphic designing program that can handle bitmap files. ( eg. Photoshop)
1. Select the graph (or any Analysis tool window) that you wish to print by clicking on it
2. Use the menu command Results -> Copy window bitmap to clipboard
3. Paste the clipboard image to the Graphic designing program.


