Virtual Dashboard
The Virtual Dashboard acts like the dashboard of a car, during the playback of the run. However, unlike the dashboard on a car, the Virtual Dashboard can be used to display any of the variables within the software. To load up the Virtual Dashboard, go to > Results > Virtual Dashboard or click the

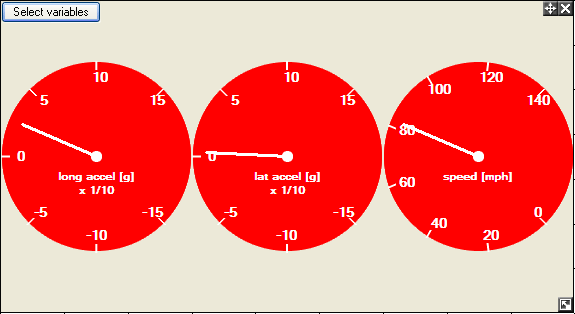
button. When you first load up the Virtual Dashboard, you will see the following:
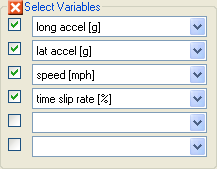
The three default dials display the longitudinal acceleration, the lateral acceleration, and the speed. If you have a run loaded, the software will automatically scale the markings on the dials to encompass the maximum and minimum for the variables. When you open up the "Select Variables" menu, you can choose up to 6 variables to be displayed:
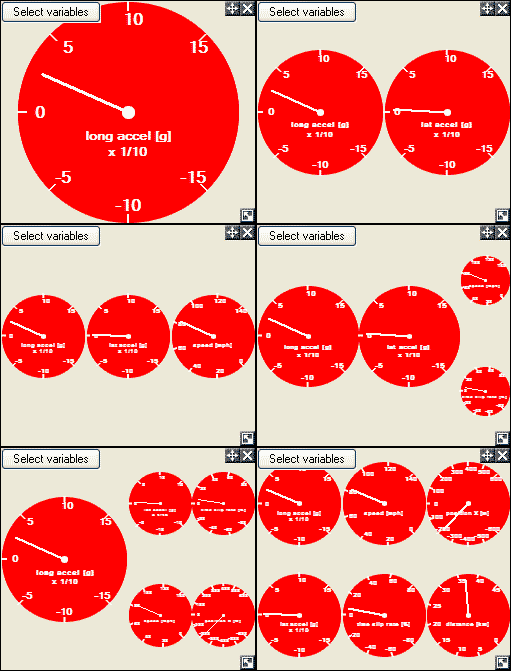
The layout of the Virtual Dashboard differs with how many variables you have showing at the time.
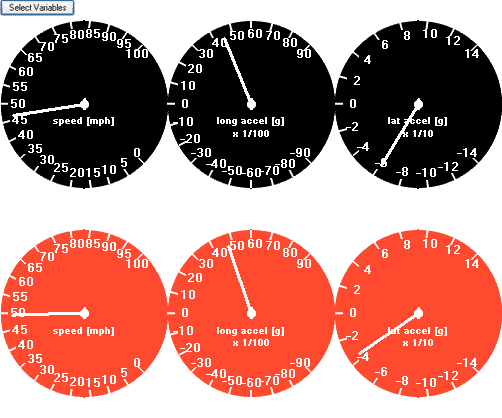
In the software, you can have up to 5 markers playing in the Real Time Playback Controls. In the virtual dash, if you have more than one marker selected, then the virtual dash will display a set of dials for each marker. The dials will also be colour co-ordinated to match the colour of the markers selected. If you select the first two markers on the Real Time Playback Controls and select the variables Speed, longitudinal acceleration and latitudinal acceleration, the Virtual Dash will look like this:
You can drag and resize the Virtual Dashboard window just like any other window, and the dials will resize to fit the window.
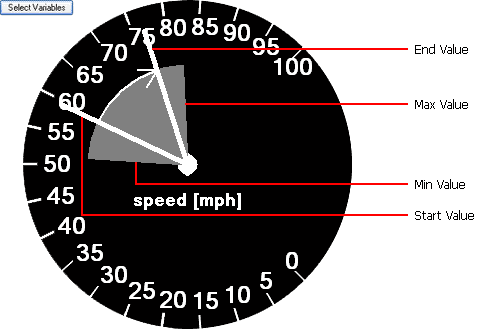
The Virtual Dashboard is interactive, and when only a singular point is selected, or when you're playing back the run, the current statistics for the point the marker is at through the run will be displayed. If you select a sector in the [[RTAnalysisTools/LapAndSectorTimes | lap and sector times table or highlight a selection (hold shift and drag with the mouse) on the track map or XY graphs, you can view the range on the dials.
The start and end values for the range of data you have selected are displayed by the two needles on the graph. The arrow between them signifies which is the start and which is the end value. Please note that if you are selecting data, and you select opposite to the direction of travel, the data displayed will show this. The grey area is the range the selected values cover, with the maximum and minimum values at the furthest points clockwise and counter-clockwise respectively.

 button. When you first load up the Virtual Dashboard, you will see the following: