Results explorer
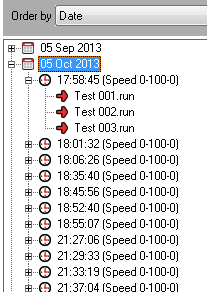
Results explorer shows the entire tests conducted by the user in tree format. It can be sorted by date, test schedule, vehicle, tester and test location.
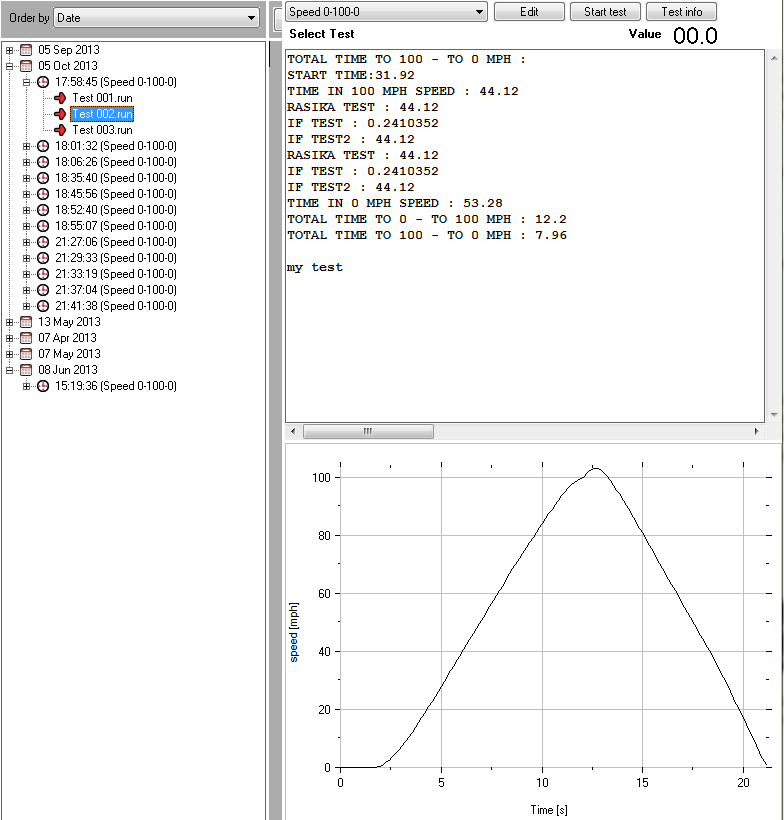
When you select the required parent test node, the test results will be displayed on the scripted test pane:
The text box portion of the “Scripted tests” pane, displays the test results configured by the script using the “RecordResults” keyword and other test summary details.
The graph can be configured by the script. By specifying a variable and its Min, Max values in the script the graph can be set to manual scale, or else it is set to auto scale. In graph the X axis denotes time and Y axis will denote values according to the variable defined in the script (speed, break, RPM, etc.). If multiple tests are performed within the same script then the lines will overlay on the display.
If the test generates multiple test files all the tests are listed under the parent test node.
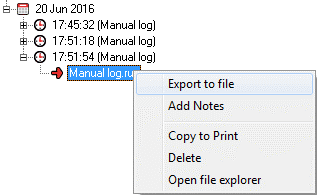
Right clicking on a node opens a context menu with following options:
- Export to File: Lets you export the Run data file to a specified location
- Add Notes: Add or change the notes about the test (stored in a file along with the Run data)
- Copy to Print: This command helps you to copy one or more data nodes one after another into an internal memory buffer. The buffered data can be copied to Windows clipboard by using the command “File -> Copy to Clipboard”.
- Delete: Removes the node with all associated data, test results and notes you added
- Open file explorer: Opens the folder where Test results and Run data files resides


